 ETF Portfolio Analyzer
Example Portfolio Analyses
See the depth and clarity of insights you'll get from our analyzer
Analyze Your Own PortfolioCurrency Distribution & Asset Types
Gain insights into your portfolio's currency exposure and asset composition. See how your investments are distributed across different currencies (USD, EUR, and others) to understand exchange rate risks. Additionally, discover the breakdown of your holdings by asset type— including equities, bonds, commodities, and other instruments—to ensure proper diversification across asset classes.
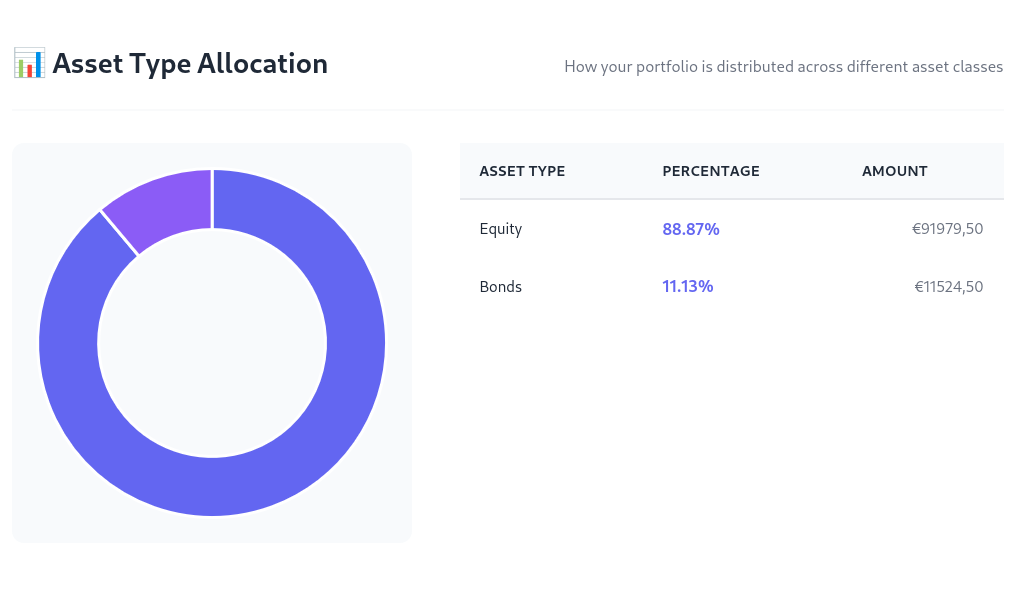
Asset type exposure
Global Diversification
Discover where your investments are truly located. Our geographic analysis breaks down your portfolio by country, revealing the real distribution of your capital across markets and helping you identify concentration risks.
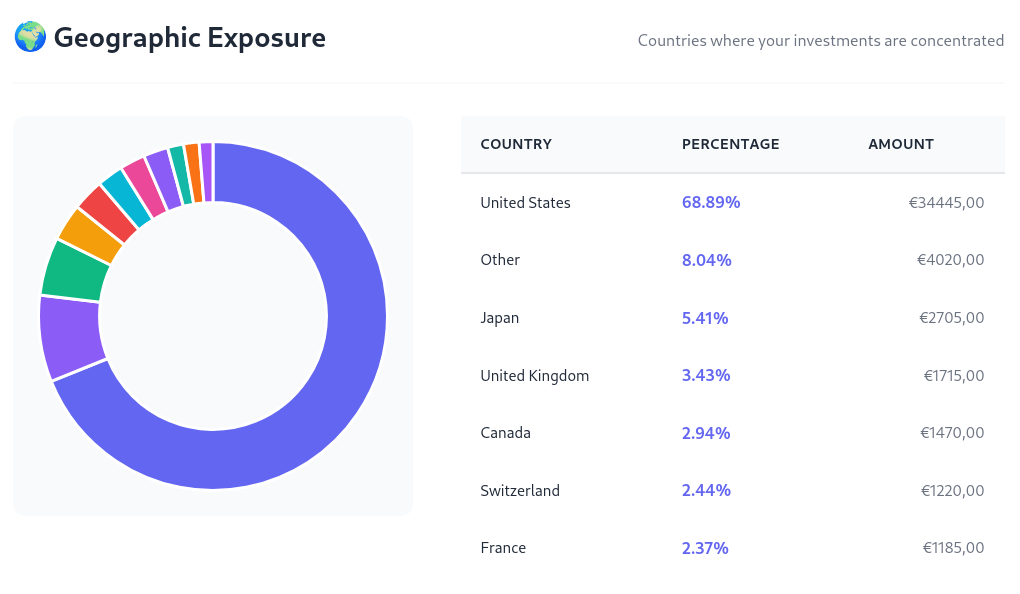
Geographic breakdown showing exposure across different countries and regions
Sector Allocation
Understand your exposure to different industries. See which sectors dominate your portfolio and identify potential concentration risks. This helps you make informed decisions about rebalancing for better diversification.
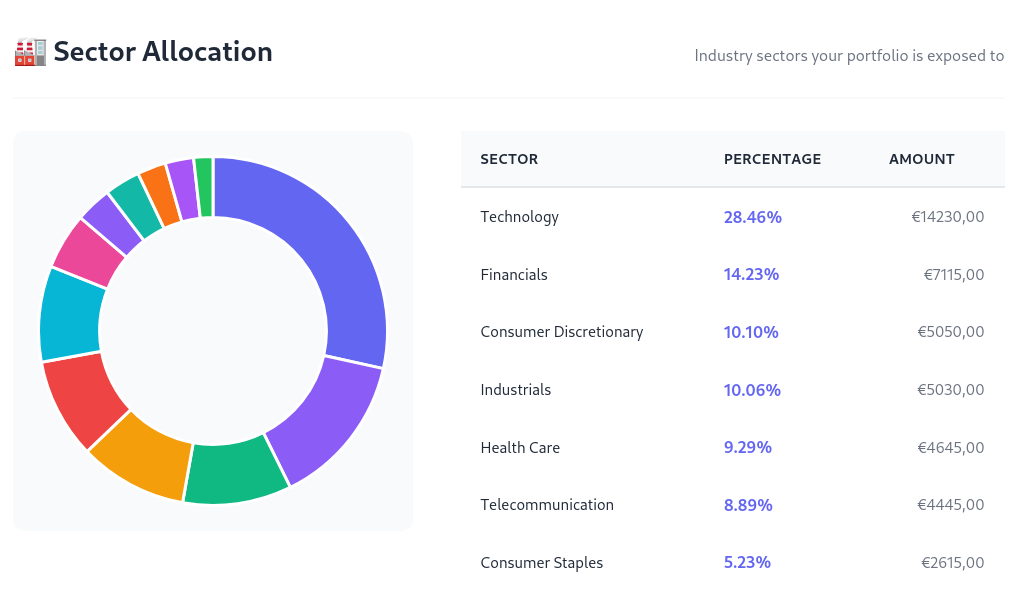
Detailed sector breakdown revealing your portfolio's industry composition
Top Company Holdings
See which individual companies you're most exposed to across all your ETFs. This reveals hidden overlaps and concentration risks that aren't obvious when just looking at ETF names. Know exactly where your money is invested.
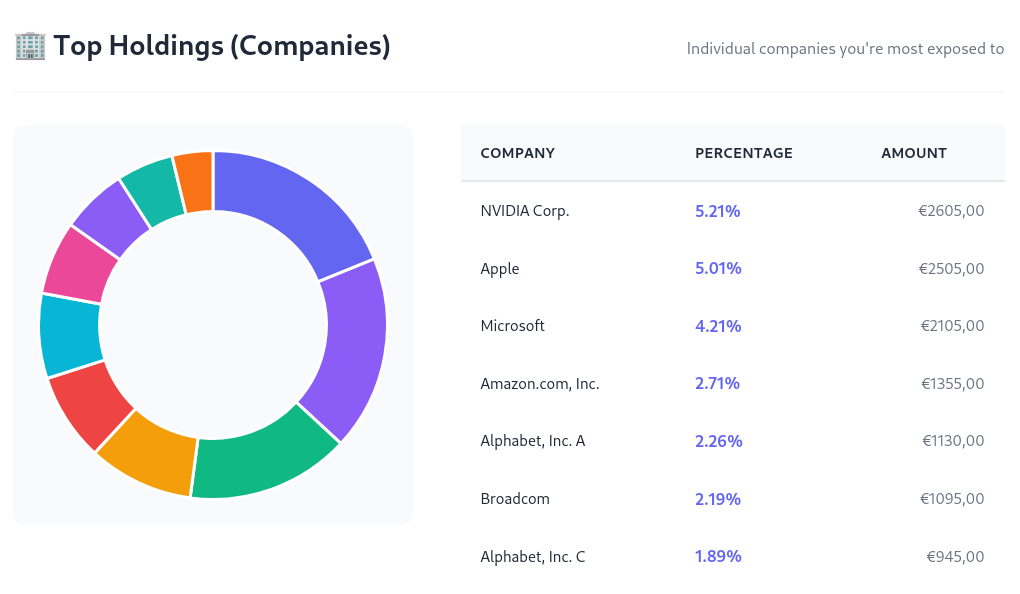
Your largest company exposures aggregated across all ETF holdings
ETF Similarity Matrix
Find out which ETFs in your portfolio are actually overlapping. Our similarity analysis compares every pair of ETFs based on their country, sector, and company exposure, revealing hidden redundancies. If two ETFs score high in similarity, you may be paying higher-than-necessary fees for exposure that could be achieved more efficiently with fewer funds.
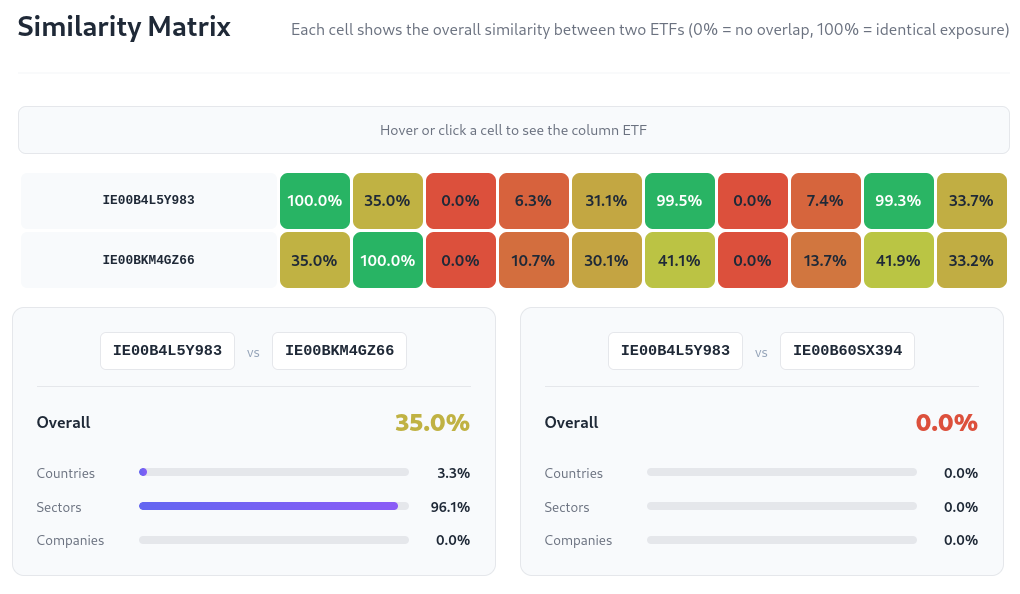
Pairwise similarity heatmap showing overlap between ETFs in your portfolio
Ready to Analyze Your Portfolio?
Get the same detailed insights for your own ETF holdings
Start Free Analysis